
This recent update is a game-changer as it gives you the freedom to design visuals exactly how you want!
As a Power BI enthusiast (Follow me on LinkedIn), I must admit that I was a bit suspicious of Microsoft’s intentions of overlooking Power BI and focusing on Fabric, like many others. But fast forward to 2025, with a host of new updates in Power BI, many of which have been long requested, Microsoft has been killing it🚀.
In this piece, I will talk about one such update that got the designer inside me excited to do more — Style Presets. With this new update, you can design visuals the way you want. No more reliance on default designs in Power BI.
🎖️ Article was awarded as Must-Read by Power BI Masterclass community
Let me add here that Custom Themes have been available for a long time, allowing you to update the overall theme of the report with custom formatting through a JSON theme file. However, there was no way to design the visual itself in multiple styles.
This type of multiple styling was only available for Table and Matrix visuals until now, as you can see below👇:
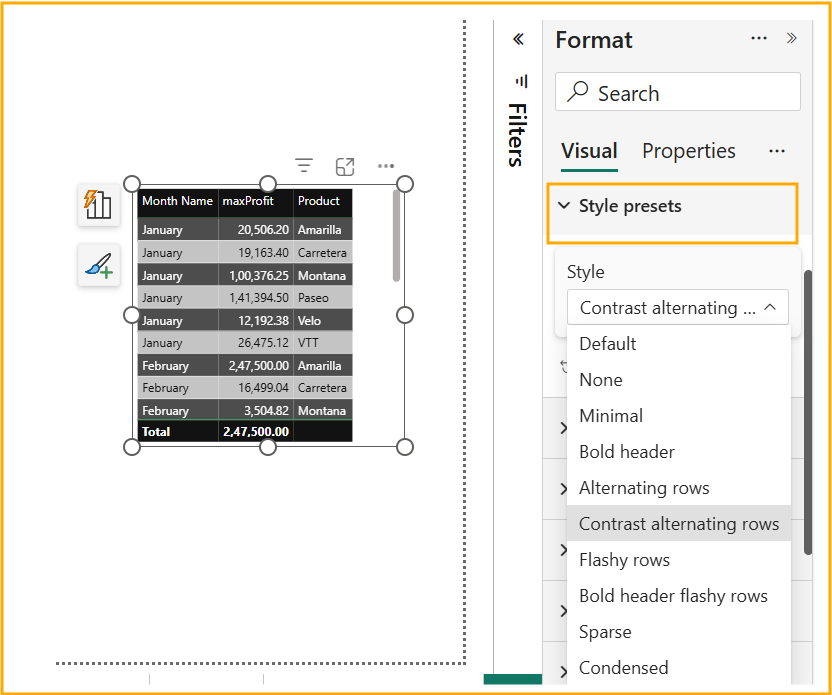
You could choose the style you wanted from the list, but it was still static and there was no way to customize.
But now, with the latest update, you can do more with the custom JSON theme file and style all your visuals as you want.
Without further ado, let’s go straight to the tutorial. I’ve used the sample dataset available in Power BI by default for this tutorial.
Bonus: Watch Style presets in action live in a video at the end of the blog! 📺🙌
Step 1: Create Your Custom Theme and Save the JSON file
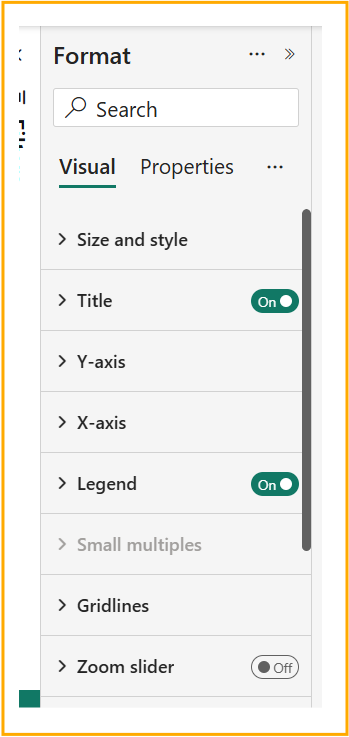
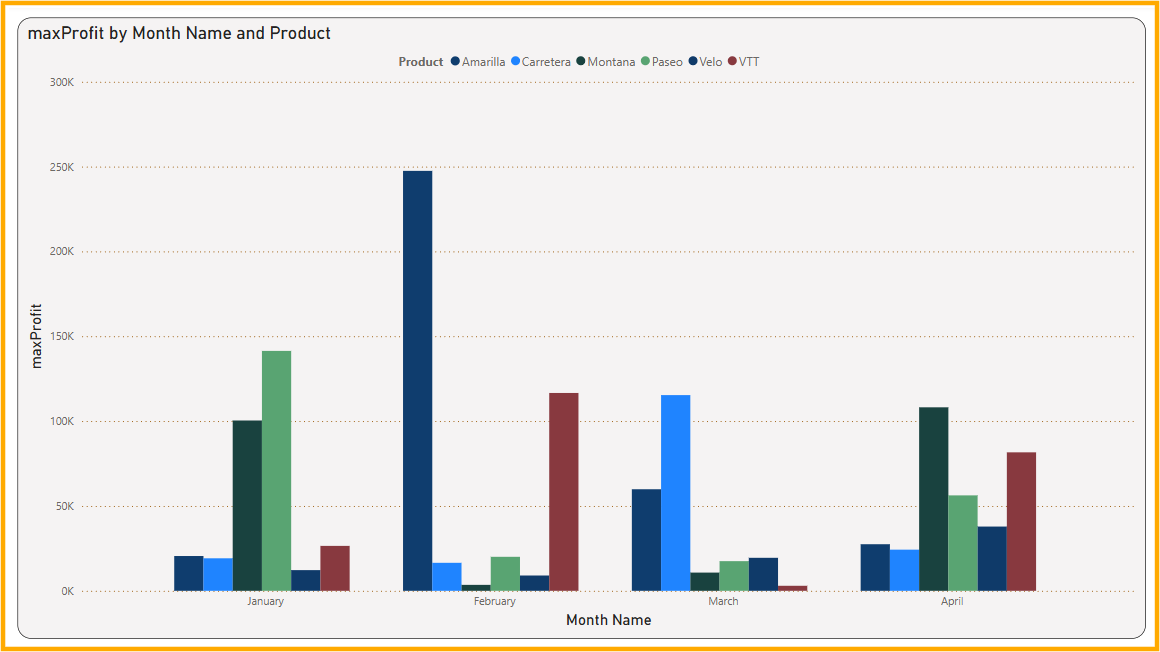
Let’s start by creating a visual first. I have created a Clustered Column Chart as you can see below. The visual shows the maximum profits earned by each product in each month.

Now, if you go to the Format pane, you will not find the Style preset available there by default.
To be able to use the style presets, we need to play around with the JSON theme file.
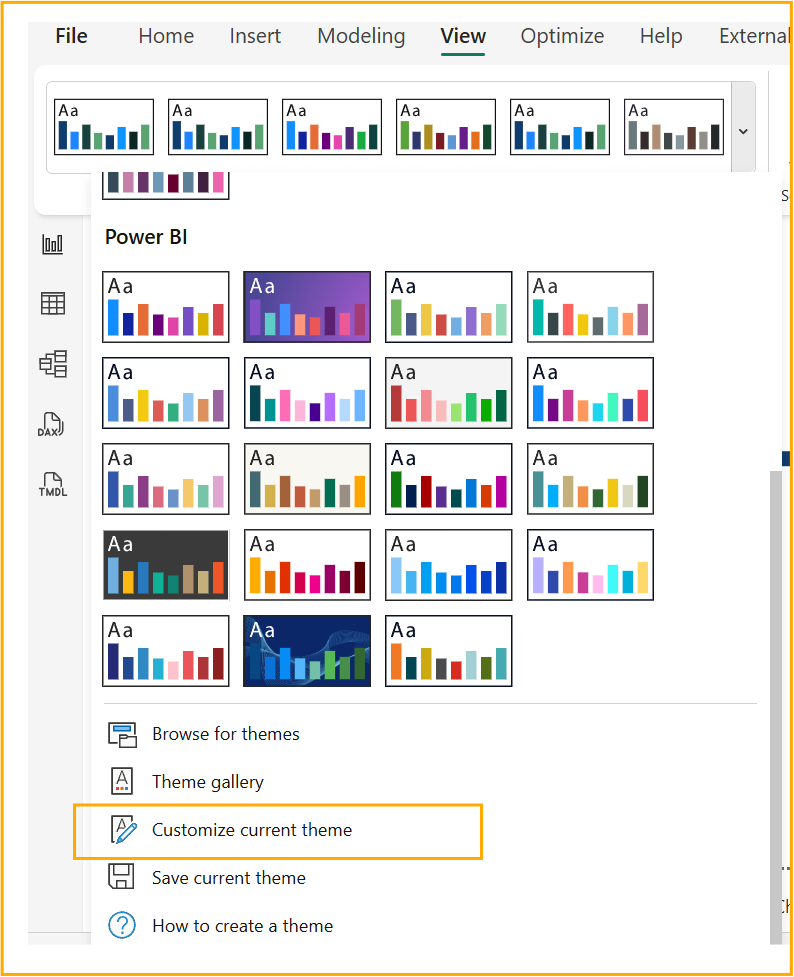
To do that, go to View → Themes and select Customize current theme.
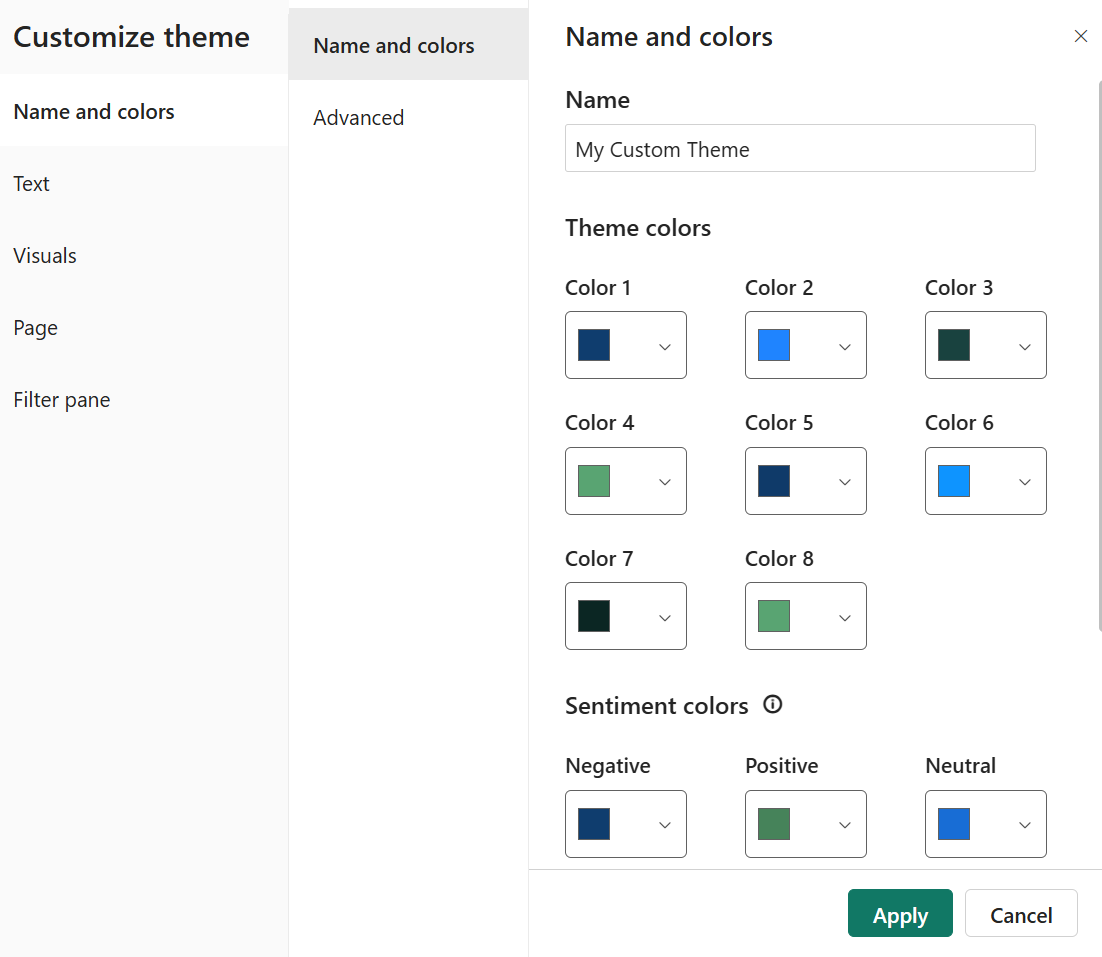
Now, if you want, you can change the design elements like background, border, font, etc. It’s up to you, or you can leave it as it is.
Make sure you give it a name and then hit Apply. I have changed a few elements and named it “My Custom Theme.”
The idea here is to save the theme in JSON so that we can play around with it. For that, go again to the View → Theme and select Save Current theme.
I saved my theme as My Custom Theme.json.

Step 2: Customizing the JSON Theme file by Adding Style Presets
The next step is to open the JSON theme file that was created in the first step. You can use any text editor to open it. I am using Visual Studio Code here.
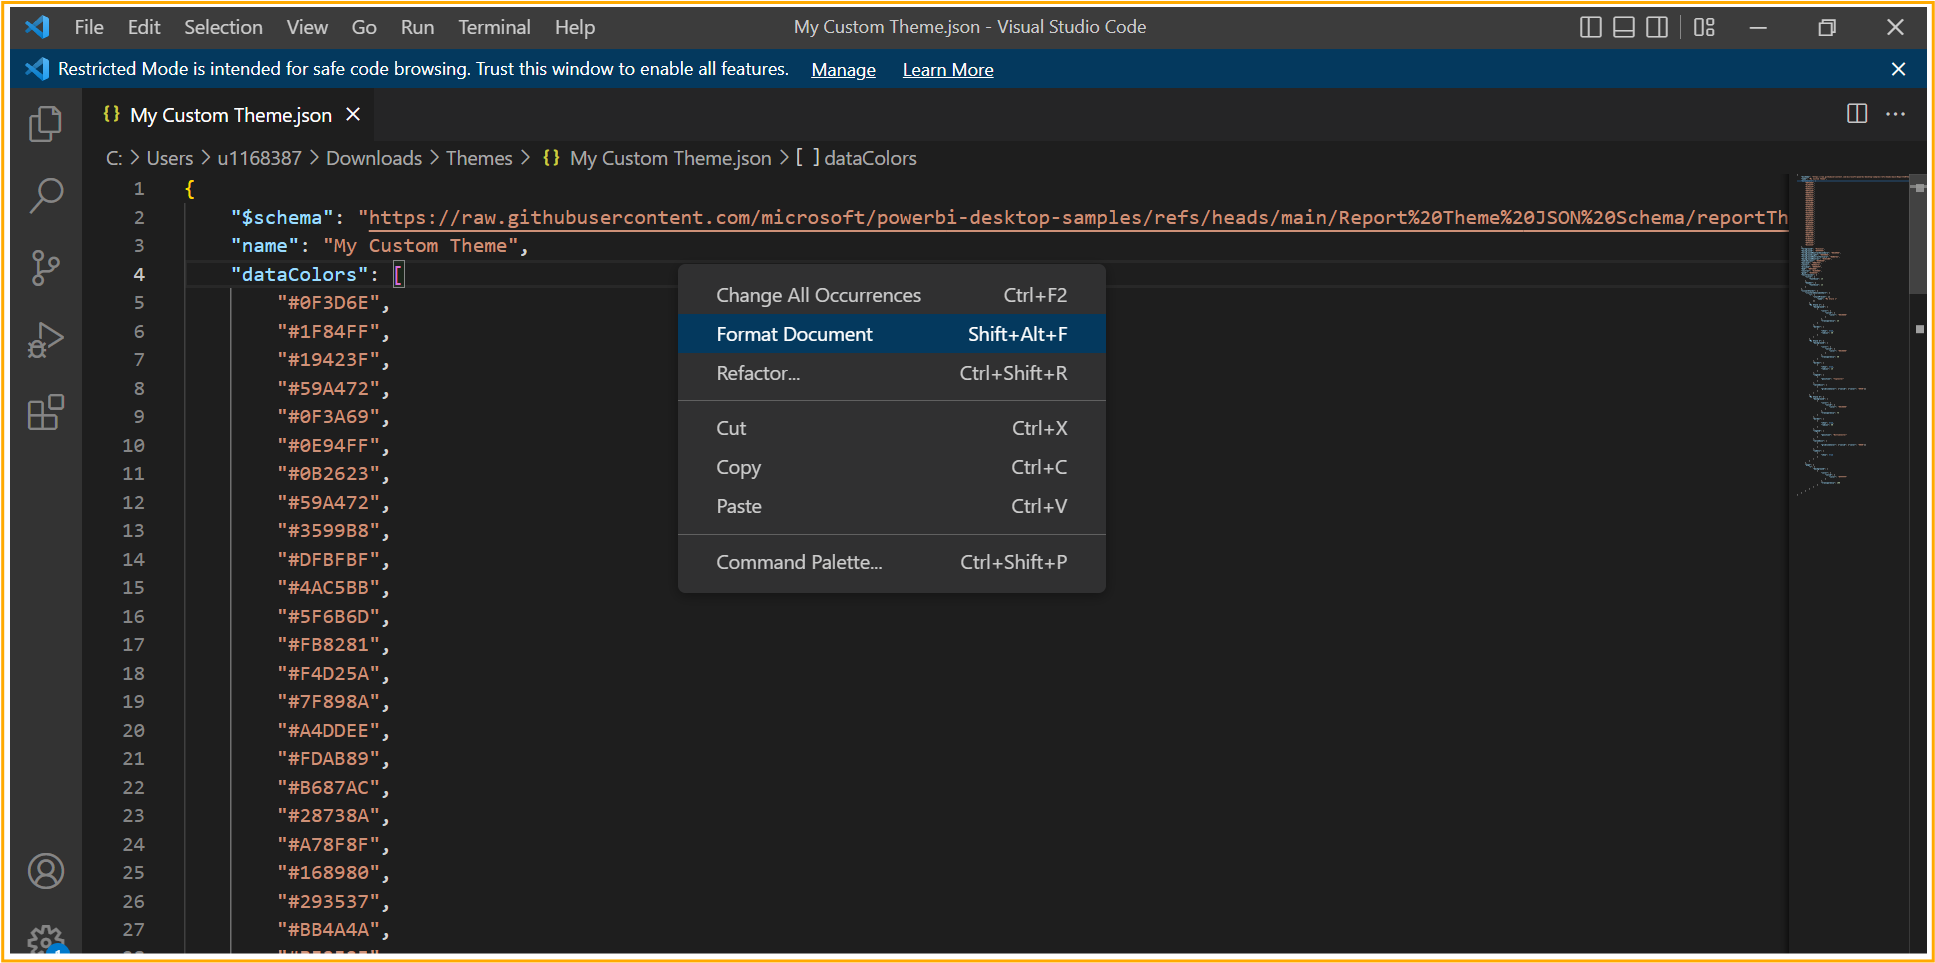
After opening it, as a first step, make sure you Right-click → Format Document to format the single-line text into a readable JSON format.
To help us identify what properties are available to style with a report theme, there is a theme schema JSON file that is usually available in a public folder. If not, you can get it from here👇.
Use report themes in Power BI Desktop — Power BI | Microsoft Learn
Here is the JSON script of My Custom Theme for your reference before we do the changes.
{
    "$schema": "https://raw.githubusercontent.com/microsoft/powerbi-desktop-samples/refs/heads/main/Report%20Theme%20JSON%20Schema/reportThemeSchema-2.141.json",
    "name": "My Custom Theme",
    "dataColors": [
        "#0F3D6E",
        "#1F84FF",
        "#19423F",
        "#59A472",
        "#0F3A69",
        "#0E94FF",
        "#0B2623",
        "#59A472",
        "#3599B8",
        "#DFBFBF",
        "#4AC5BB",
        "#5F6B6D",
        "#FB8281",
        "#F4D25A",
        "#7F898A",
        "#A4DDEE",
        "#FDAB89",
        "#B687AC",
        "#28738A",
        "#A78F8F",
        "#168980",
        "#293537",
        "#BB4A4A",
        "#B59525",
        "#475052",
        "#6A9FB0",
        "#BD7150",
        "#7B4F71",
        "#1B4D5C",
        "#706060",
        "#0F5C55",
        "#1C2325"
    ],
    "foreground": "#121212",
    "background": "#FFFFFF",
    "foregroundNeutralSecondary": "#6C6966",
    "backgroundLight": "#E5E0DA",
    "foregroundNeutralTertiary": "#ABA7A2",
    "backgroundNeutral": "#C6C2BE",
    "tableAccent": "#4E9466",
    "maximum": "#0B2F54",
    "center": "#59A472",
    "minimum": "#0E94FF",
    "bad": "#0F3D6E",
    "neutral": "#186DD5",
    "good": "#46835A",
    "textClasses": {
        "title": {
            "fontSize": 14
        },
        "header": {
            "fontSize": 13
        }
    },
    "visualStyles": {
        "*": {
            "*": {
                "background": [
                    {
                        "color": {
                            "solid": {
                                "color": "#ECE8E8"
                            }
                        },
                        "transparency": 25
                    }
                ],
                "border": [
                    {
                        "show": true,
                        "radius": 30
                    }
                ]
            }
        },
        "page": {
            "*": {
                "background": [
                    {
                        "color": {
                            "solid": {
                                "color": "#FFFFFF"
                            }
                        },
                        "transparency": 100
                    }
                ]
            }
        }
    }
}
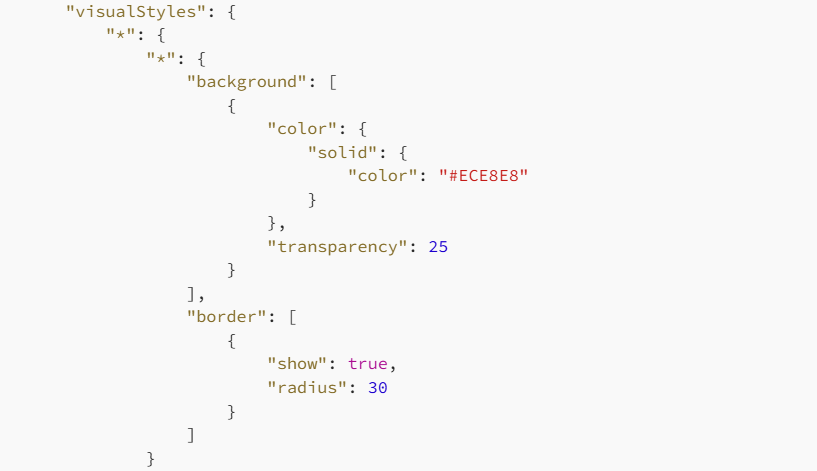
We are all set now to add the style presets in the JSON file. We have to do that under the visualStyles properties. Here is the current definition under visualStyles for my theme.
Let’s go and modify properties step by step.
Change 1: Setting up Default Style Preset for the Visual
Although this is an optional addition if you want your visual to have a default style, it’s always good to define one. If not, Power BI uses the option Default from the style preset dropdown to show the old state.
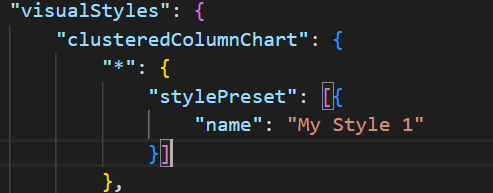
To set the default state, set the stylePreset properties as below under visualStyles →clusteredColumnChart →”*” → stylePreset
I have named my default style preset as My Style 1
Change 2: Defining Properties of each Style Preset
I am creating three style presets here: My Style 1, My Style 2 and My Style 3. So in this step, we will define the properties of each.
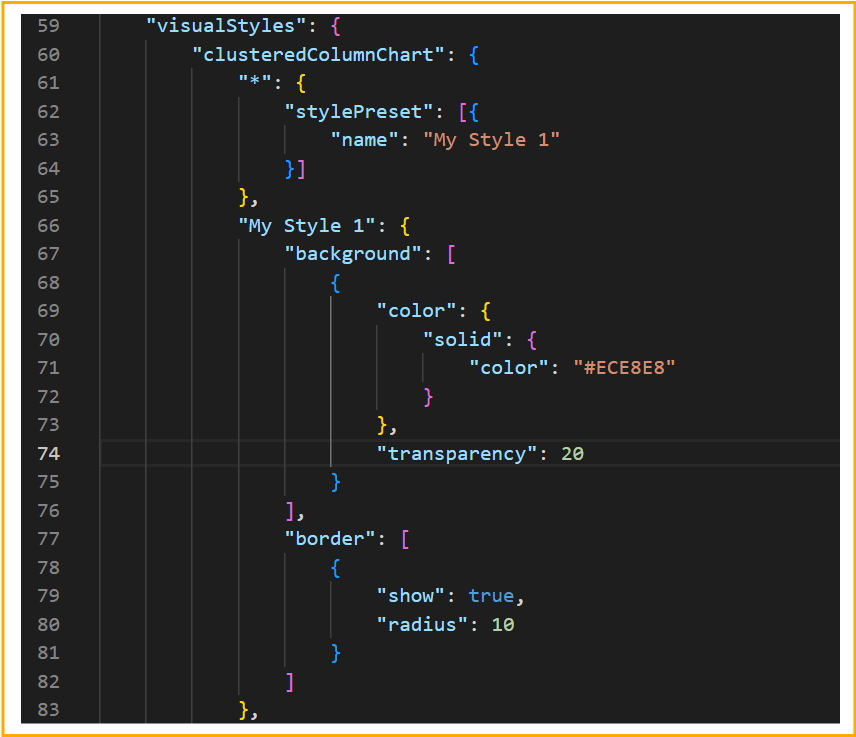
My Style 1
Here are the property updates I have done:
- Visual background transparency set to 20.
- Visual border radius set to 10.
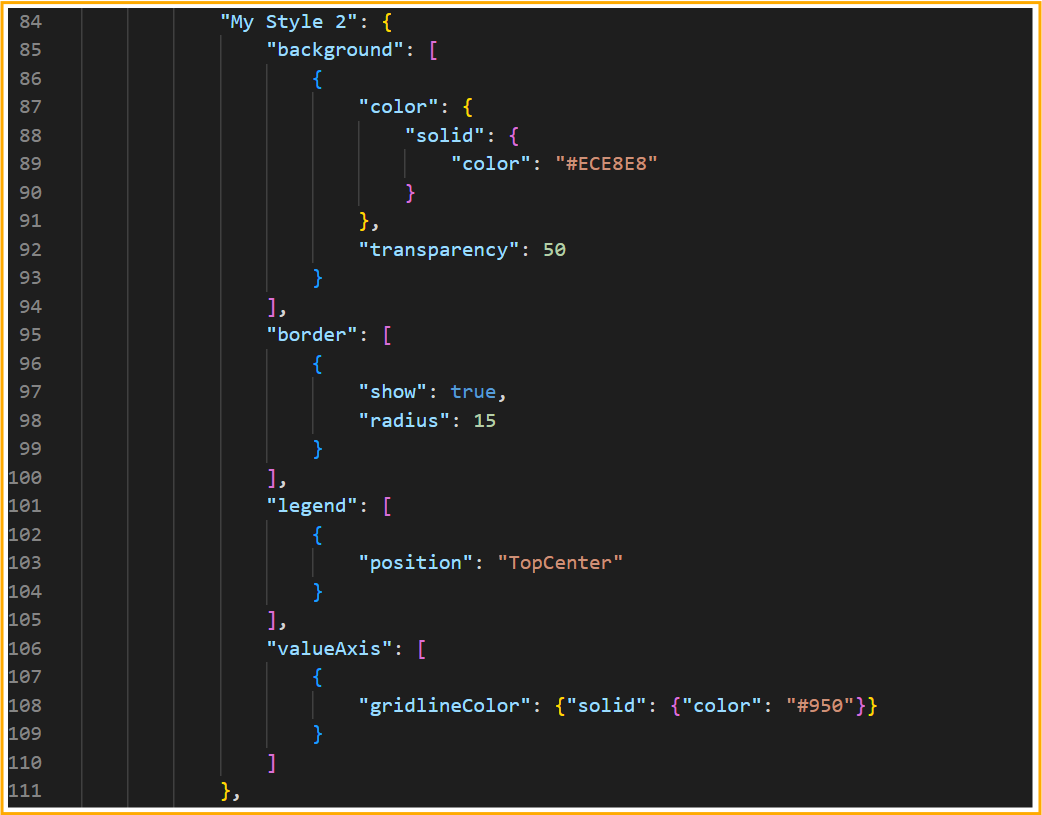
My Style 2
- Visual background transparency set to 50.
- Visual border radius set to 15.
- Legend’s position updated to be at TopCenter.
- Axis gride lines added in Red color.
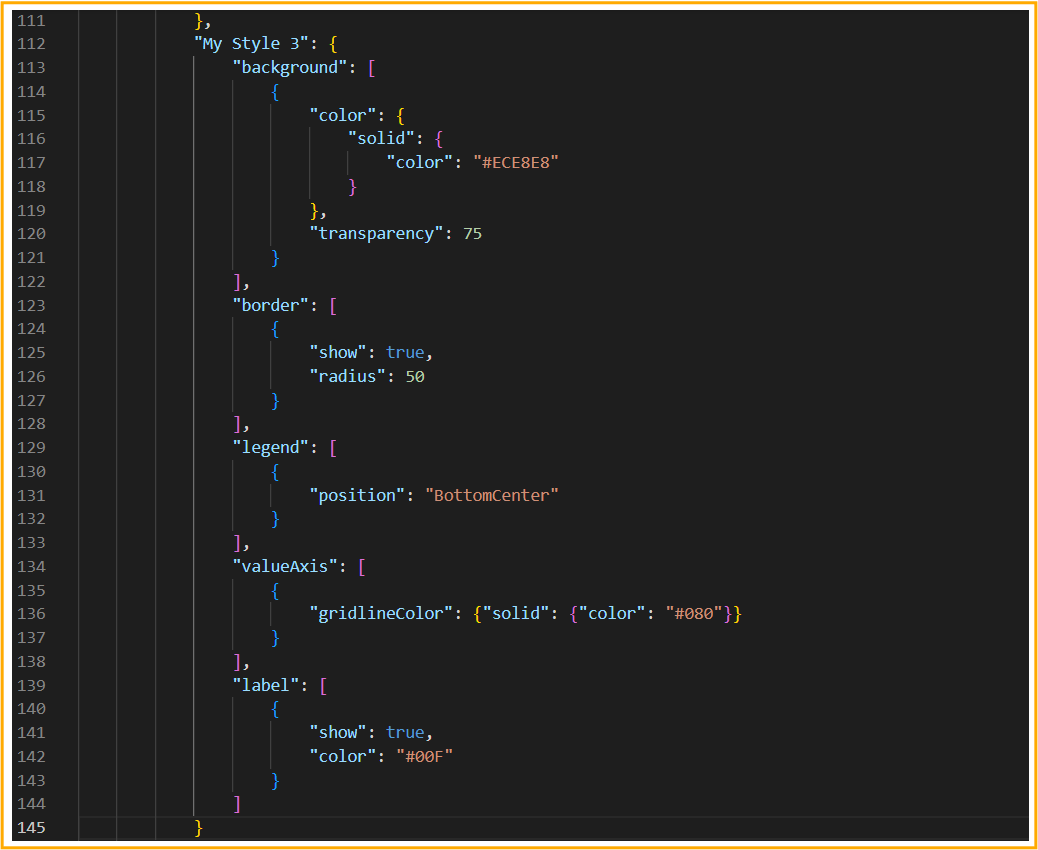
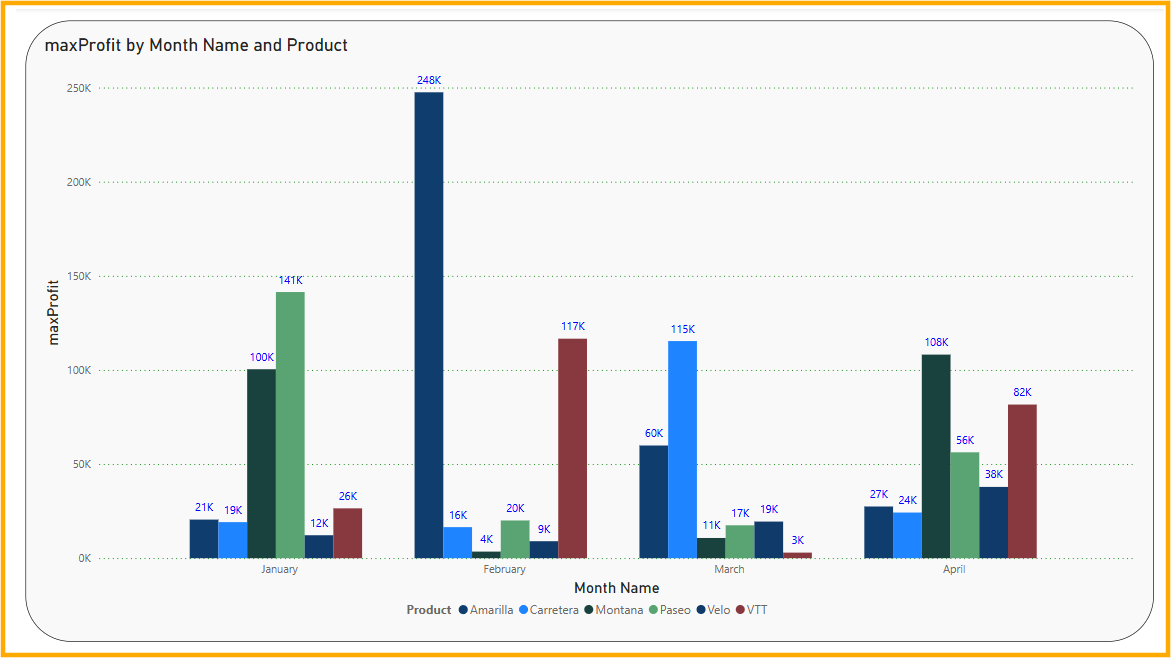
My Style 3
- Visual background transparency set to 75.
- Visual border radius set to 50.
- Legend’s position updated to be at BottomCenter
- Axis grid lines added in Green color.
- Visual labels added to be shown in Blue color.
Okay, with this we are done with the changes needed for all the three style presets. Make sure you save the JSON file after these changes.
Note: Keep a close eye on the brackets; make sure all the braces that are opened are closed at the end, otherwise the file will give an error.
Here is the updated My Custom Theme JSON script after the style preset changes for your reference.👇
{
    "$schema": "https://raw.githubusercontent.com/microsoft/powerbi-desktop-samples/refs/heads/main/Report%20Theme%20JSON%20Schema/reportThemeSchema-2.141.json",
    "name": "My Custom Theme",
    "dataColors": [
        "#0F3D6E",
        "#1F84FF",
        "#19423F",
        "#59A472",
        "#0F3A69",
        "#0E94FF",
        "#0B2623",
        "#59A472",
        "#3599B8",
        "#DFBFBF",
        "#4AC5BB",
        "#5F6B6D",
        "#FB8281",
        "#F4D25A",
        "#7F898A",
        "#A4DDEE",
        "#FDAB89",
        "#B687AC",
        "#28738A",
        "#A78F8F",
        "#168980",
        "#293537",
        "#BB4A4A",
        "#B59525",
        "#475052",
        "#6A9FB0",
        "#BD7150",
        "#7B4F71",
        "#1B4D5C",
        "#706060",
        "#0F5C55",
        "#1C2325"
    ],
    "foreground": "#121212",
    "background": "#FFFFFF",
    "foregroundNeutralSecondary": "#6C6966",
    "backgroundLight": "#E5E0DA",
    "foregroundNeutralTertiary": "#ABA7A2",
    "backgroundNeutral": "#C6C2BE",
    "tableAccent": "#4E9466",
    "maximum": "#0B2F54",
    "center": "#59A472",
    "minimum": "#0E94FF",
    "bad": "#0F3D6E",
    "neutral": "#186DD5",
    "good": "#46835A",
    "textClasses": {
        "title": {
            "fontSize": 14
        },
        "header": {
            "fontSize": 13
        }
    },
    "visualStyles": {
        "clusteredColumnChart": {
            "*": {
                "stylePreset": [{
                    "name": "My Style 1"
                }]
            },
            "My Style 1": {
                "background": [
                    {
                        "color": {
                            "solid": {
                                "color": "#ECE8E8"
                            }
                        },
                        "transparency": 20
                    }
                ],
                "border": [
                    {
                        "show": true,
                        "radius": 10
                    }
                ]
            },
            "My Style 2": {
                "background": [
                    {
                        "color": {
                            "solid": {
                                "color": "#ECE8E8"
                            }
                        },
                        "transparency": 50
                    }
                ],
                "border": [
                    {
                        "show": true,
                        "radius": 15
                    }
                ],
                "legend": [
                    {
                        "position": "TopCenter"
                    }
                ],
                "valueAxis": [
                    {
                        "gridlineColor": {"solid": {"color": "#950"}}
                    }
                ]
            },
            "My Style 3": {
                "background": [
                    {
                        "color": {
                            "solid": {
                                "color": "#ECE8E8"
                            }
                        },
                        "transparency": 75
                    }
                ],
                "border": [
                    {
                        "show": true,
                        "radius": 50
                    }
                ],
                "legend": [
                    {
                        "position": "BottomCenter"
                    }
                ],
                "valueAxis": [
                    {
                        "gridlineColor": {"solid": {"color": "#080"}}
                    }
                ],
                "label": [
                    {
                        "show": true,
                        "color":{"solid":{"color":"#00F"}}
                    }
                ]
            }
        },
        "page": {
            "*": {
                "background": [
                    {
                        "color": {
                            "solid": {
                                "color": "#FFFFFF"
                            }
                        },
                        "transparency": 100
                    }
                ]
            }
        }
    }
}
Step 3: Importing the updated JSON theme File and Seeing it work
To import the JSON theme file into the report, got to View → Theme and click Browse for themes and select the updated JSON file.

If your file has no errors, the import will be successful and you will get this window👇
Once the theme file is successfully imported, you should now be able to see the Style preset option in the formatting pane. 👇
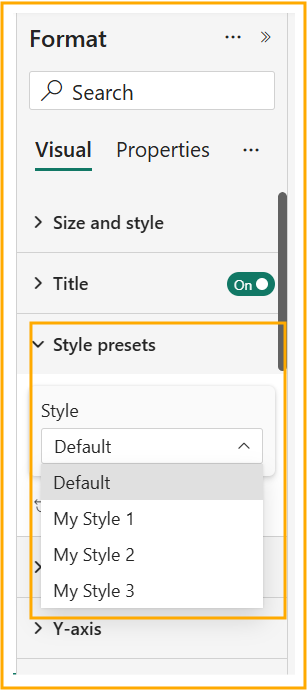
As you can see above, all the custom styles created by me are visible now in the dropdown. Let’s go and try them one by one and see the magic.
Result of My Style 1

Result of My Style 2
Result of My Style 3
🚀🚀🚀As you can see, all the style presets are working like a charm. Here is a small video of it in action 👇.
Design Visuals your own way using Style Presets in Power BI
As you must have seen in the video, as soon as you click Reset to default option, the style presets gets reset to My Style 1 because that was the default style that we defined in the custom theme JSON file.
Conclusion
As we saw in the blog, the style preset update in Power BI is a game-changer for sure. What I tried to cover in this blog is just the tip of the iceberg. There is a lot more to try and explore. Do give it a try and share your experience working with style presets.
Source (s):
Design Visuals Your Own Way Using Style Presets in Power BI